37 STOCKS
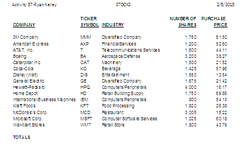
1. In this assignment we compared different stock prices and gain/loss of many different companies.
2. Some necessary abilities for this was knowing how to use auto sum, knowing how to fill down, shading certain boxes, changing the font, among others
3. I learned how to create a spreadsheet that could display percentages by typing in an equation.
4. I think I completed this assignment flawlessly.
5. I would change some of my answers to the questions.
Excel 22
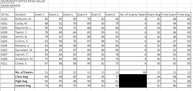
1.In this assignment we entered the exam scores of eleven students and then took the averages and added in their final exams as well.
2. Some necessary abilities to complete this activity was the ability to use the auto sum and button and knowing how to enter equations
3.I learned new things such as how to use auto sum to calculate averages.
4.I don't think I made any major mistakes when completing this activity.
5.If i redid this assignment most likely I would have made the chart border bolder.
Iphone Games 45
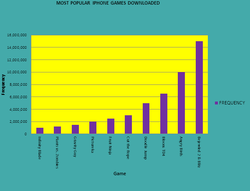
1. In this assignment we made a data table of iphone games and how many times they had been downloaded. Then we made a clustered column chart displaying this data.
2. To complete this activity you needed to know how to enter data into a table and also how to change the colors of the plot and chart and also the bars. Then you have to change the titles to 90 degrees.
3.By doing this work, I learned how to better create a column chart. I also learned how to move my data by using the select data tool. Without that, I couldn't move my data around to make my chart look correct. I also learned how to fill and customize my chart.
4. In this assignment, I made my chart and labeled my data very well. That part of the assignment was easy.
5. Something that I need to do better with is using the select data tool. I was stumped on that one for a while.
Group Activity- Pie Charts
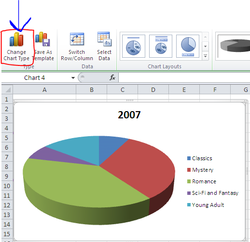
1. In this assignment, I worked with Ryan Kelley and Paige Soares to create an activity to teach the class how to create a pie chart. We created a powerpoint to inform the class how to create it, demonstrate how to do it, and then give them an activity for them to practice on their own.We watched various videos and researched how to create one and then did it for our own.
2. The technology skills used were making a spreadsheet and then creating a pie chart with that data. Then using the labels and format options to make it look its best. Moving it to a new page was another option used. the layout and style functions really allowed us to customize this chart.
3. I learned how to work better with others and how to create a pie chart. Kill two birds with one stone, as I put it. I learned better how to share my ideas by using Google Docs and just conversing with my peers, and I learned excels magical feature of creating a pie chart.
4. I created the chart very well, formatted, and customized it very well. The activities were simple to create and I created that well too.
5. I need more work with conversing with my peers. I did do it but there could be more of that done.
